Website Down Checker
Is the website down or just me? Type a website and we'll check, in real time, whether it's down for everyone or just for you. You get a clear yes or no, the reason, and what to do next.
About Website Down Checker
This website down checker is a free tool that answers one question: is the website down or just me? It tells you whether a website is genuinely offline or only unreachable from your own connection. It sends a real HTTP request from our server, runs a second independent check from inside your browser, and compares the two. A typical free "is website down" check gives one verdict from one place, which is the information you already have. ToolsPivot built this one to answer that question the way people actually type it into Google at 2am.
What This Tool Actually Checks
The tool runs a live HTTP request to the address you enter and classifies the response into one of four honest states rather than a simple up or down. It goes out with a realistic browser user agent, follows redirects one hop at a time with a hop cap and loop detection, and pins every hop to a validated public IP so the probe cannot be tricked into reaching internal networks. Ping is deliberately not used, because plenty of healthy servers drop ICMP packets while serving web traffic fine.
ToolsPivot built it for the person staring at an error screen, not for a systems administrator with a terminal open. Store owners checking a broken checkout, freelancers fielding a panicked client email, and support agents confirming a customer report all land here for the same reason: they need a second opinion from outside their own network, in plain English, in seconds. If you want the deeper technical view instead, with bulk URL support and a full redirect chain, the server status checker covers that ground.
The problem it solves is misattribution. People spend an hour rebooting routers for an outage that was never theirs, or call their hosting provider about a site that was only blocked by a corporate firewall. Two vantage points settle that before you waste the hour.
The Four Verdicts and What Each One Means
Almost every free down checker returns two states, and that binary is where the false alarms come from. A Cloudflare-protected site that answers an automated request with a 403 is not down. A site returning a 500 error is not fully down either, but it is certainly not fine. Collapsing those into "up" or "down" produces answers that are technically defensible and practically useless.
| Verdict | What triggers it | What it actually means |
|---|---|---|
| Up | A 2xx response, or a 3xx redirect that resolves to a 2xx | The site answered normally. It is working. |
| Responding, blocking checks | 401, 403 or 429, or a 503 served from behind a CDN or WAF | The server is alive and answering. It is refusing automated visitors, which is not the same thing as an outage. |
| Having problems | Any 5xx response, or a 200 that hides a database or maintenance page | The site is reachable but broken on its own side. Visitors will see something wrong. |
| Down or unreachable | No HTTP reply at all, confirmed by a second attempt | Nothing answered. The result is broken down further into the specific reason. |
That second state is the one that saves the most wasted effort. Bot protection returning a 403 to an automated checker is common enough that uptime monitoring projects publish workarounds for it, and a checker that reads 403 as "down" will page you about an outage that does not exist. If you want to see the raw response for yourself, including the exact headers the server sent back, run the same address through the HTTP headers checker.
How the ToolsPivot Website Down Checker Works
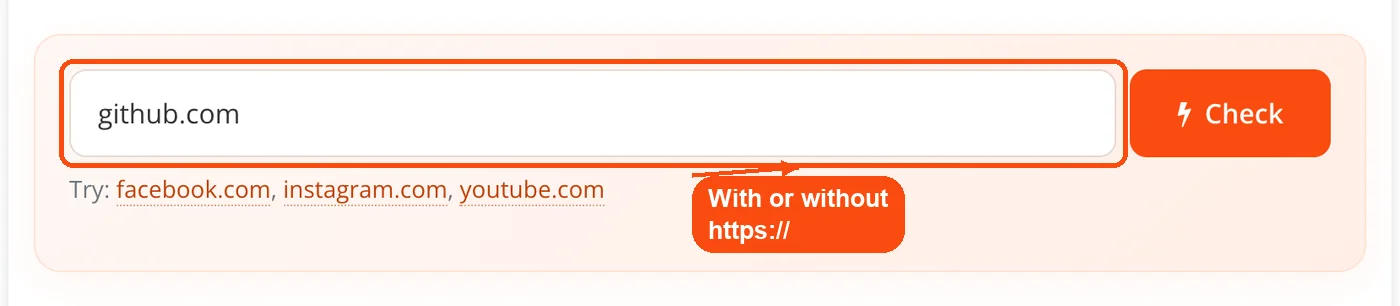
- Enter the address. Type a domain with or without a scheme. The input is cleaned up, given https if it is missing, and rejected before any network call if it is not a valid address.
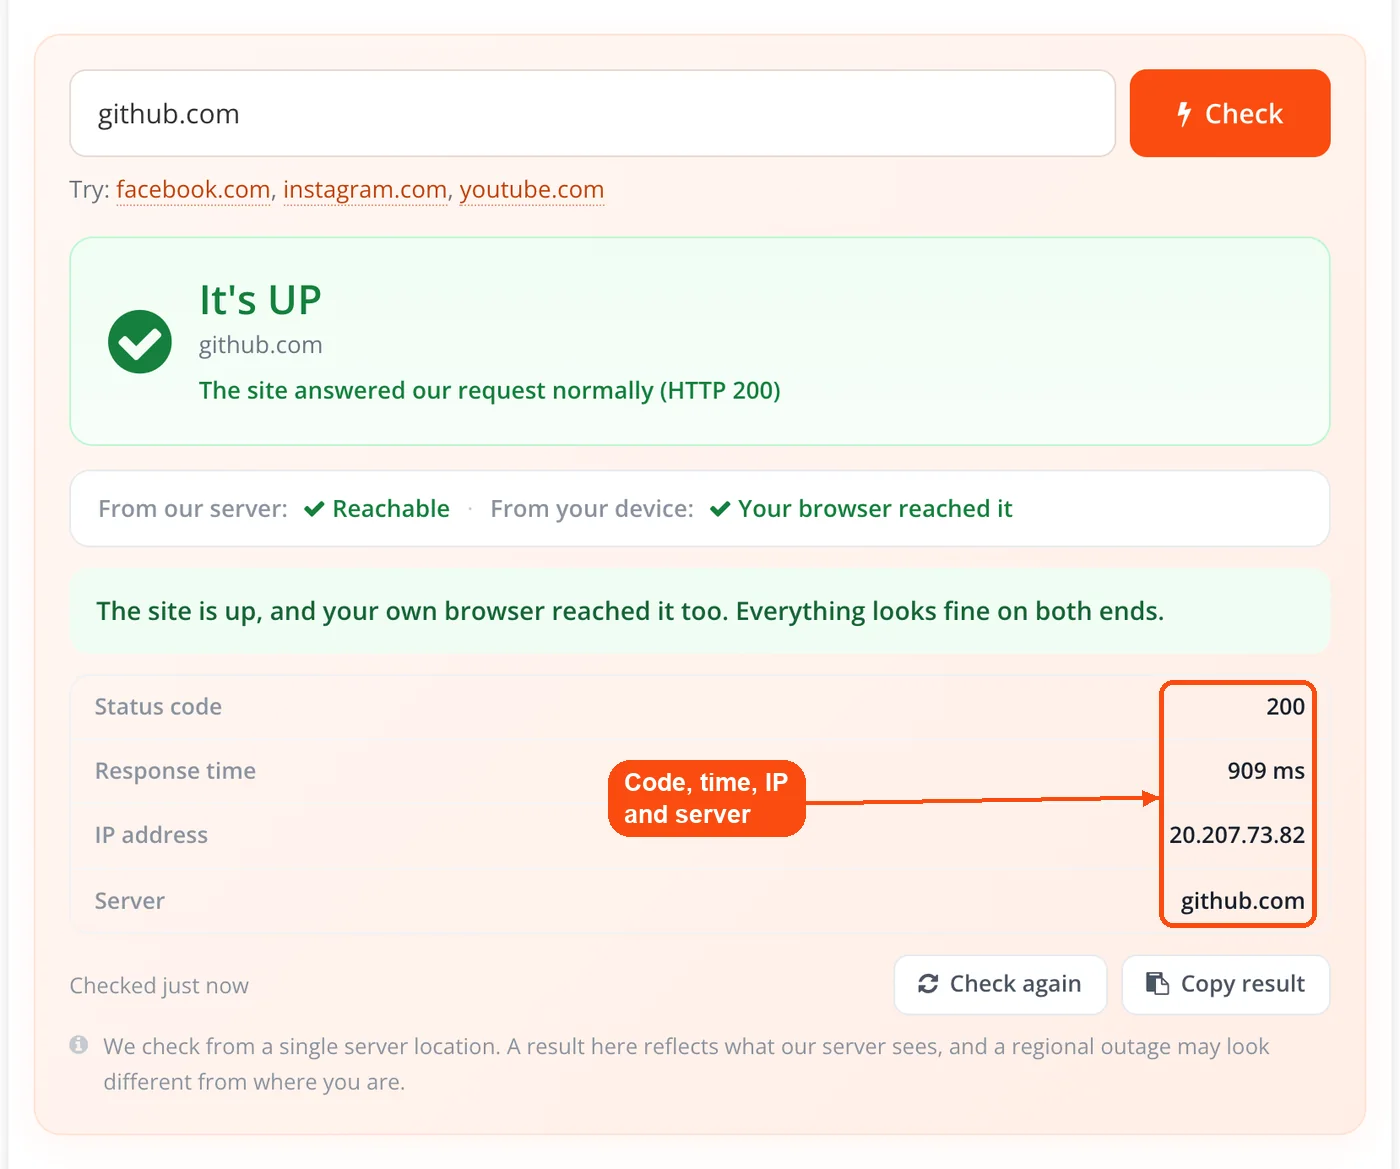
- The server probe runs. A real HTTP request goes out, following redirects manually and recording the status code, response time, resolved IP and final destination. Cross-check that address with a domain to IP lookup if it looks wrong.
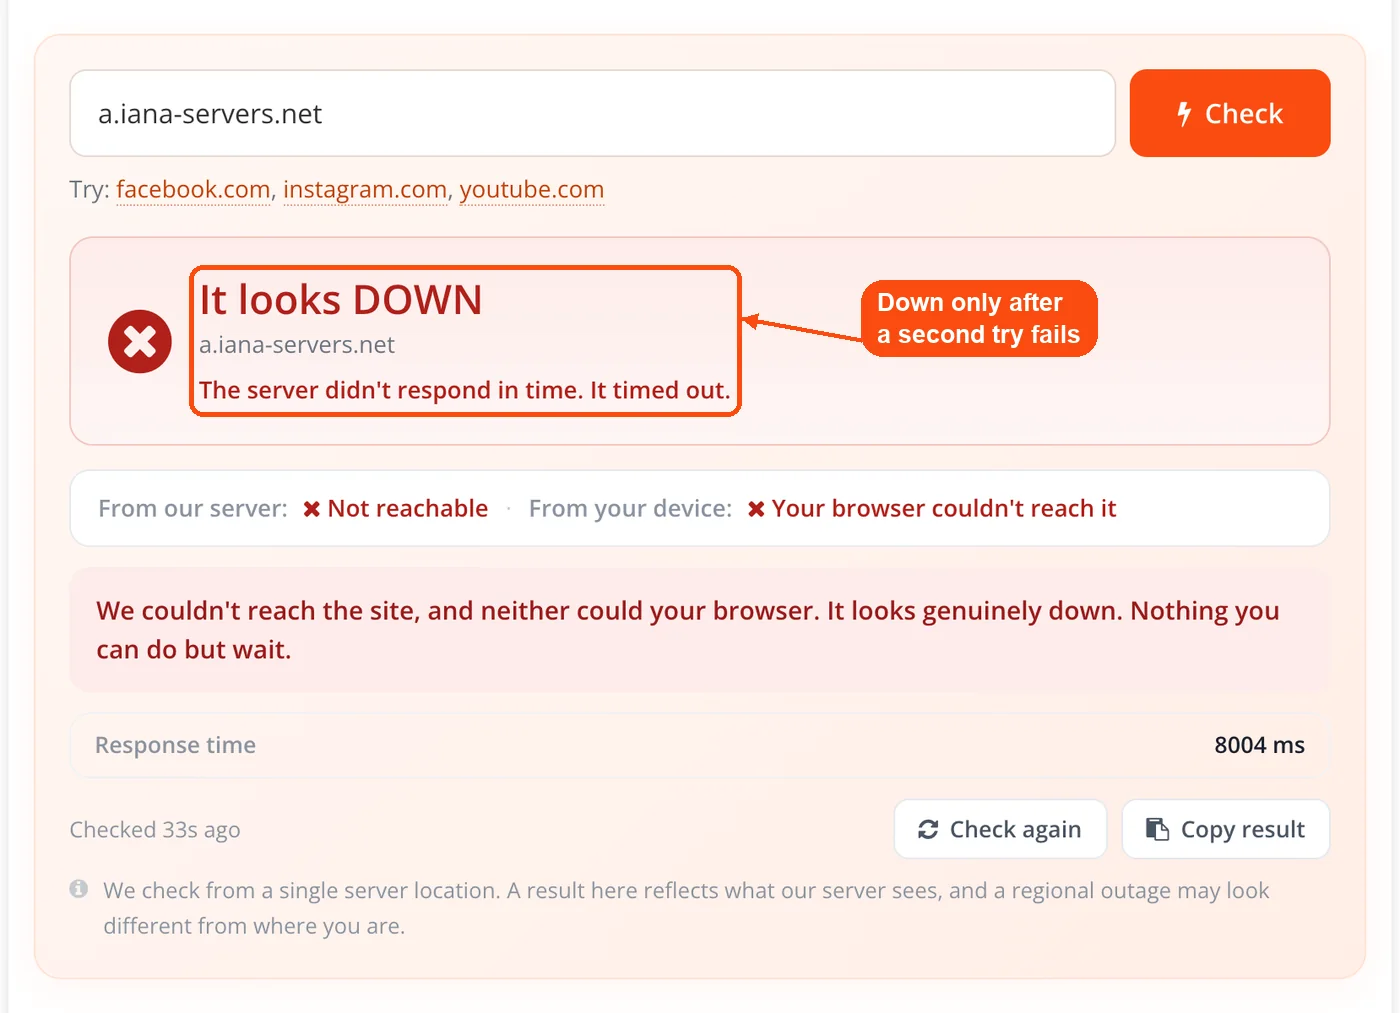
- A hard failure gets retried. If nothing answers, the tool waits briefly and tries again. Down only sticks if the second attempt fails too, filtering out the transient DNS, TLS and deployment blips that make other checkers cry wolf. TLS failures get their own label, and the SSL checker confirms whether an expired certificate is the cause.
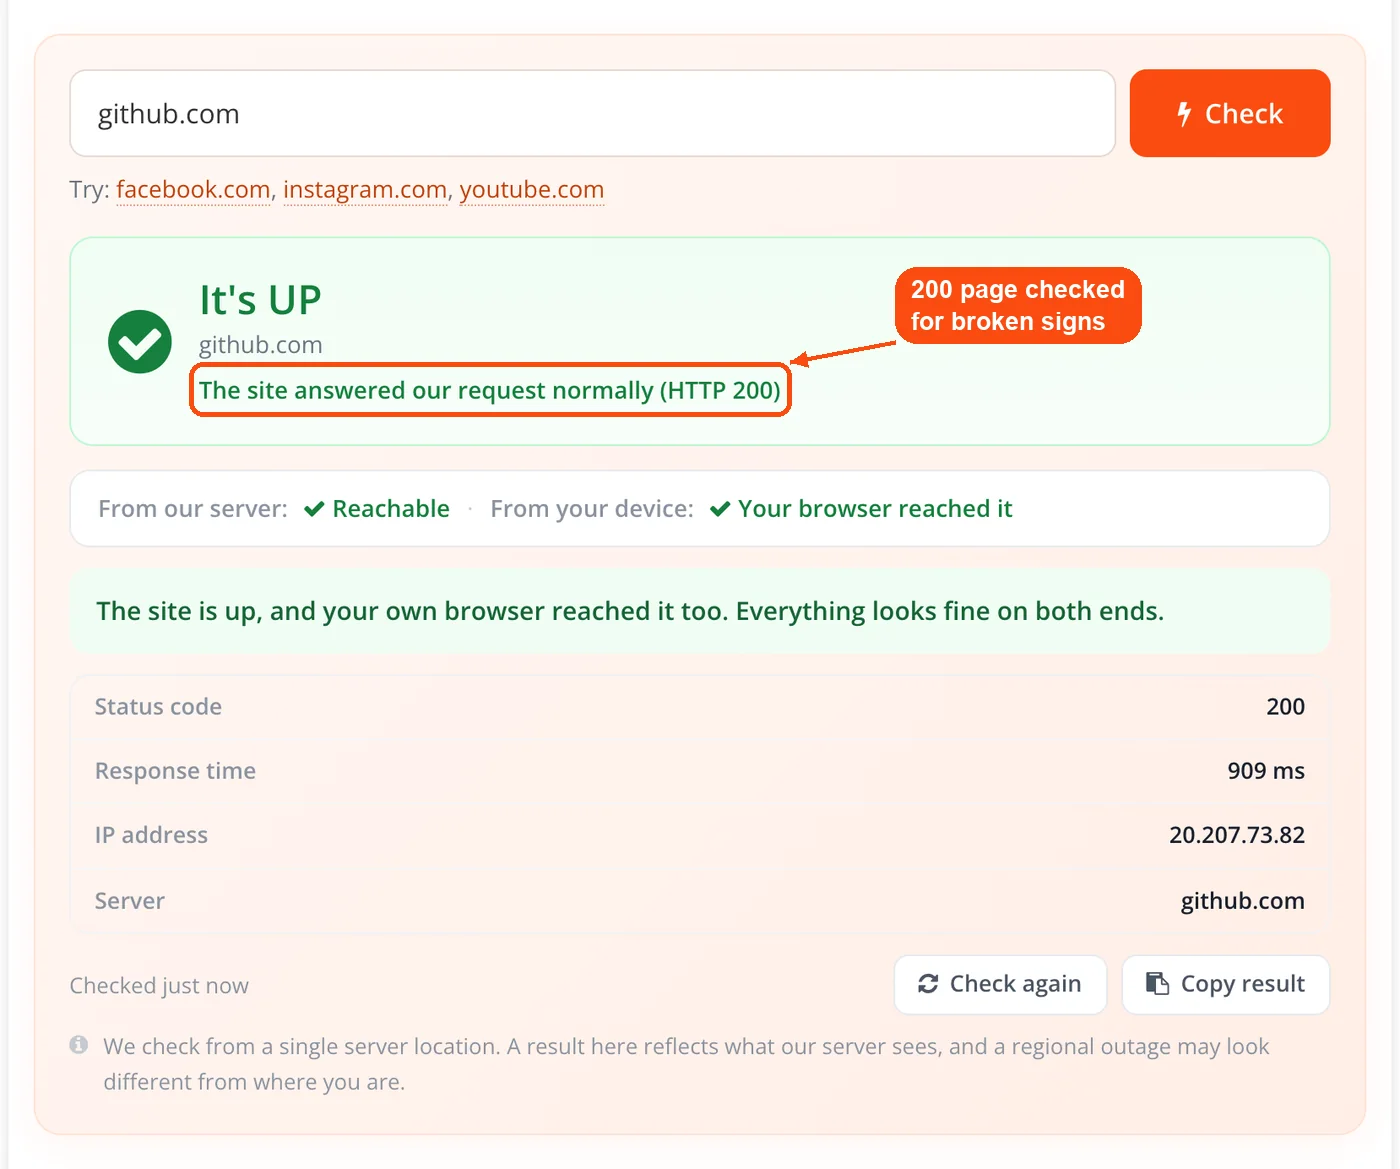
- A 200 gets inspected. On a successful response, roughly the first 64 KB of the page body is read and scanned for the signatures of a broken page. A match downgrades the verdict from up to having problems.
- Your browser runs its own check. At the same time, a no-cors fetch fires from your device to the same address. It succeeds if your network reached the host and fails if your DNS or connection could not.
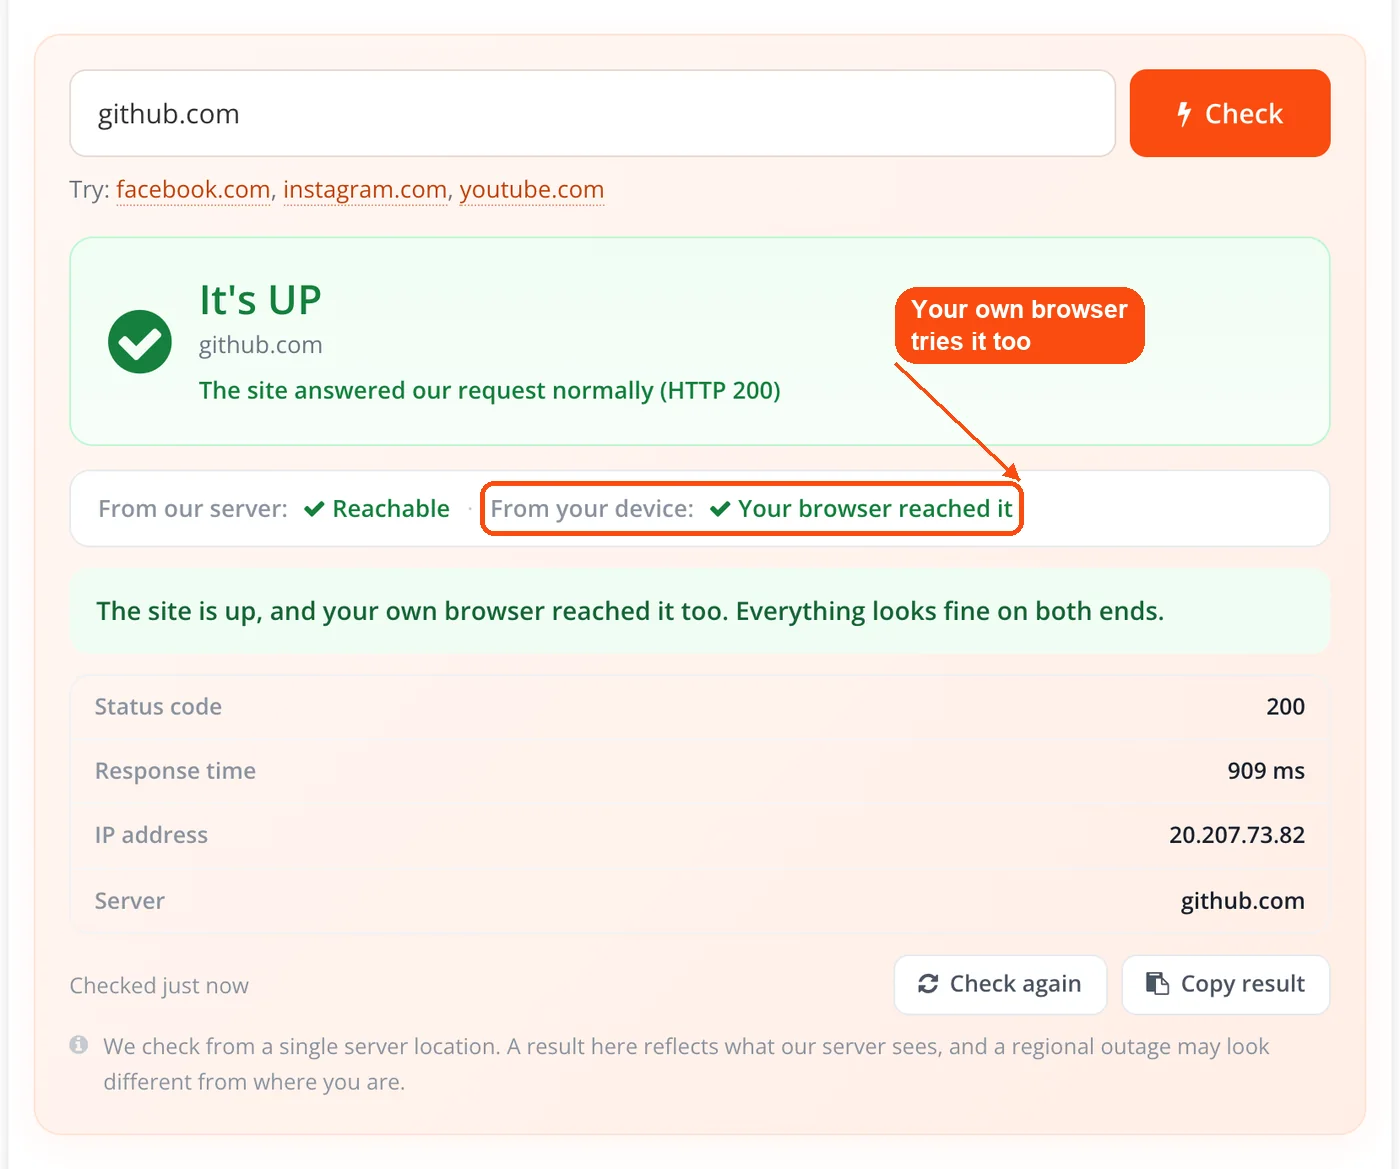
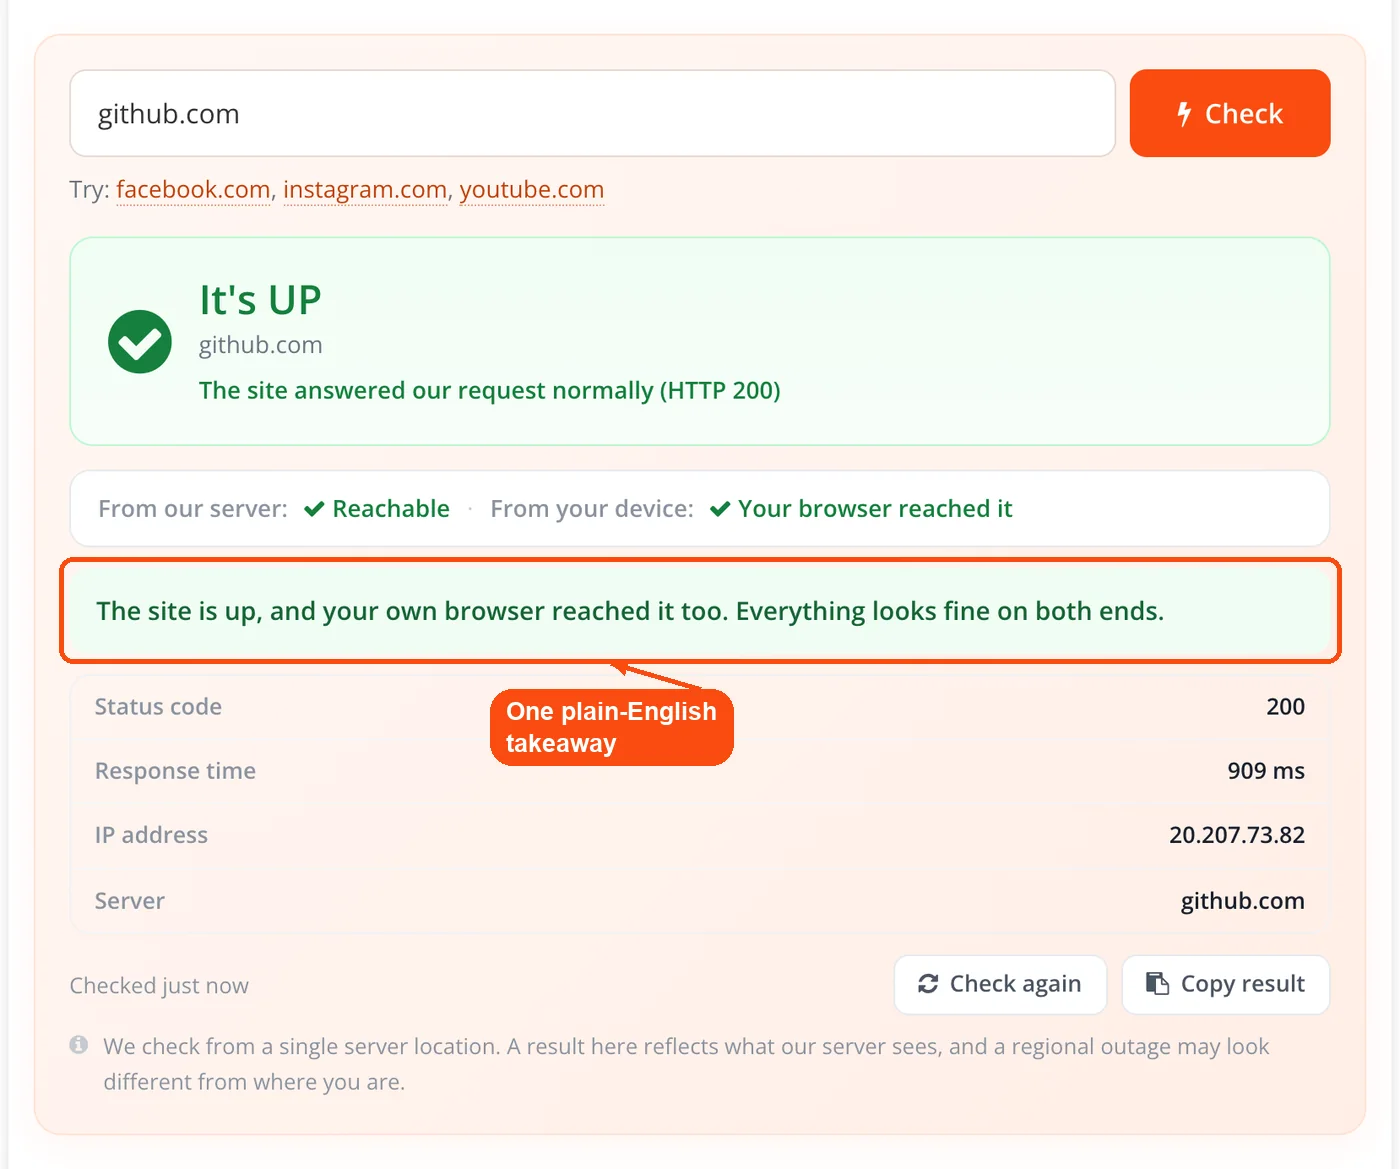
- The two results get combined. Both verdicts are merged into one plain-English takeaway, with a fix checklist attached whenever the evidence points at your side rather than the site's.
Is the Website Down or Just Me?
Every run answers the two-part question people actually ask: "is website down for me, or for everyone?" The tool answers that by checking from two genuinely different places instead of one. Our server sits outside your network entirely, so it sees what the wider internet sees. Your browser sits inside your network, behind your router, your ISP, your VPN and whatever security software your employer installed. Comparing the two isolates the fault to one side or the other.
This matters because the usual claim is hollow. Plenty of checkers advertise "down for everyone or just you" while testing only from their own infrastructure, which tells you nothing you did not already know from your own failed page load. Testing from the visitor's browser too is uncommon in the free tier, though not unheard of, and a handful of competitors do pair a server-side proxy request with a client-side fetch. Multi-region testing is the more common approach, with several rivals checking from eight, fifteen or more locations at once.
Four combinations come out of the comparison. Both succeed and the site is fine. Our server succeeds while your browser fails, which is the "it's just you" case that triggers the fix checklist. Both fail, and the outage is real. Our server fails while your browser succeeds, the rarest pattern, which normally means the site is geo-blocking or rate-limiting our probe specifically. To work out whether your own network is the variable, the IP address lookup shows how you appear to the outside world and the browser detection tool confirms what your device reports.
Why a Site Can Return 200 and Still Be Broken
A 200 status code means the server answered, not that visitors got a working page. WordPress sites that lose their database connection typically return a 200 with a plain error message, and maintenance pages, suspended accounts and "service temporarily unavailable" screens often do the same. Any checker that stops at the status code calls all of these healthy.
ToolsPivot reads the first chunk of the response body, looks for the phrases those failure pages actually contain, and downgrades the verdict on a match. It is a signature match rather than a rendering engine, so it catches common server-side breakages but not client-side failures like a JavaScript bundle that never loads. When a site answers correctly but feels sluggish rather than broken, availability is not the problem and the page speed checker is the better next step.
Why Is a Website Down? Four Different Failures
Ask "why is website down?" and the honest answer is that "down" is one word covering four unrelated failures, each with a different fix. Naming the specific one is the difference between a useful answer and a red box.
- The domain does not exist. DNS returns no records at all. This is usually an expired registration, a typo, or a domain that was never registered. A WHOIS lookup will show you the registration and expiry dates, and the domain availability checker confirms whether it has lapsed back onto the open market.
- DNS is not resolving right now. The domain exists but the lookup is failing at this moment, which points at a nameserver problem or a change that has not propagated. Checking the records directly with a DNS lookup tells you whether the records themselves are intact.
- The connection was refused. DNS resolved, the server is reachable, and it actively rejected the connection. That normally means the web service has stopped even though the machine is running.
- The request timed out. Nothing answered before the deadline. Overload, a firewall dropping packets silently and a dead server all look identical from outside.
When to Run This Check
Run it to check if a website is down the moment it fails to load, before you change anything on your own machine. Diagnosing from a single vantage point is how people end up flushing DNS caches for problems that were never local. It is equally useful when someone else reports a fault you cannot reproduce.
A Client Says Their Site Is Broken
Paste their domain in before you open a support ticket or an SSH session. Up with a working browser check means the fault is on their device, so you walk them through a cache clear instead of spending an hour on a healthy server. Having problems with a 500 response means the opposite, and you have the status code ready to hand your hosting provider.
Right After a Deployment
Push a release, then check the production URL immediately instead of waiting for a customer to report it. A 502, or a verdict downgraded by a database error page, surfaces within seconds of the deploy landing. If the site is up but sending visitors somewhere unexpected, the redirect checker traces where the chain ends.
During a Traffic Spike
Sale days and campaign launches push shared hosting past its limits, and the first symptom is usually a 503 rather than a full outage. Checking during the spike tells you whether the server is refusing requests or merely slowing down, which decides whether you scale up or wait it out.
On a Restricted Network
Office, school and public wifi networks block far more than people expect. When the server check passes and the browser check fails on a corporate connection, a content filter is almost always the answer, and no amount of restarting your laptop will change it.
What to Do When the Problem Is on Your Side
When the server check succeeds and your browser check fails, ToolsPivot shows a fix checklist rather than leaving you to guess. The steps run roughly in order of how often they work.
- Try a different network. Switching from wifi to mobile data takes ten seconds and rules out your router, ISP and local DNS in one move.
- Open the site in a private window. This bypasses cached files and disables most extensions, which covers the two most common browser-side causes.
- Turn off your VPN or proxy. Many sites block traffic from datacenter IP ranges outright. If you route through a shared exit node, check whether that address has been flagged using the blacklist lookup.
- Flush your DNS cache. A stale record pointing at an old server survives long after the actual DNS change went through.
- Check your security software. Antivirus suites and parental controls block sites quietly, often without showing a block page.
How This Compares to Other Down Checkers
| Capability | This tool | Typical free down checker |
|---|---|---|
| Verdict states | Four (up, blocking, problems, down) | Two (up or down) |
| Bot blocks such as 403 or 429 | Labelled as responding but blocking checks | Usually reported as down |
| Check from your own device | Yes, a real fetch from your browser | Rare; most test only from their servers |
| Test locations | One server, plus your browser | Often several regions |
| 200 hiding a broken page | Detected by scanning the response body | Reported as up |
| False alarm control | Retries once before declaring down | Single attempt |
| Guidance when it is your fault | Step by step fix checklist | Rarely offered |
| Account required | No | Sometimes, for full results |
Honest Limitations
The server-side probe runs from a single location, so it cannot detect a regional outage. A site that is down across one continent and fine everywhere else will look healthy here, and tools probing from eight or fifteen regions genuinely have the advantage on that question. Every result carries a single-location caveat for this reason.
The browser check is more limited than it looks. A no-cors fetch tells you whether your network reached the host, not what the host sent back, so it confirms connectivity rather than a working page. Some privacy settings and extensions block the request outright, producing a false "it's just you" reading.
Body scanning catches known failure signatures, so an unusual custom error page will slip through. The check is a snapshot, not monitoring: it describes this moment and nothing else, so continuous alerting needs a dedicated uptime monitor. The address you enter is sent to our server to run the probe, which is unavoidable for any external check, and no account or email is required.
Frequently Asked Questions
Yes, ToolsPivot provides it free with no account, no email and no usage caps. Every part of the result is shown, including the response code, the resolved IP and both vantage points.
It compares a check from our server with one from your own browser. If our server reaches the site and your browser cannot, the fault is on your side and the fix checklist appears.
Because a 401, 403 or 429 means the server answered and refused, which is the opposite of offline. CDN bot protection commonly returns these codes to automated visitors while serving real people normally.
No, it uses a real HTTP request instead. Many servers ignore ICMP packets entirely while serving web traffic normally, so ping produces false negatives that HTTP does not.
Yes, and it happens often. Database errors, maintenance screens and suspended accounts frequently return a 200, so the tool reads the start of the page body and downgrades the verdict on a match.
Enter the address and you get a live answer: our server and your own browser both check the site at that moment, and the two results are compared. The verdict answers "is website down right now" for that moment only, since the check is a snapshot rather than ongoing monitoring, so run it again if the site keeps failing.
A single failed request is unreliable evidence. DNS hiccups, TLS handshake failures and mid-deployment gaps all cause one-off failures, so a hard-down result is retried after a short pause and only reported if it fails again.
This tool answers a consumer question about one site, with two vantage points and plain-English guidance. A server status checker is the technical view, handling bulk URLs, redirect chains and certificate detail for an audit rather than a single failure.
You can check any publicly reachable address. Private, loopback and reserved IP ranges are refused for security reasons, so localhost and internal addresses will not work.
No, the server-side probe runs from one location only, and every result says so. A genuinely regional outage will not be visible here, which is a real limitation worth knowing about before you rely on the verdict.
Downdetector aggregates user-submitted reports, so it reflects what people are saying rather than what a server returned. This tool sends a real request and reports the real response, which is more precise for one site and less useful for spotting a large platform outage early.
Brief outages lasting a few minutes rarely affect rankings. Repeated or prolonged downtime is different, because crawlers hitting errors on multiple visits reduce how often they return, and reduced crawling eventually shows up in visibility.
The site is most likely blocking or rate-limiting requests from our server while allowing normal visitors through. Geo-restrictions produce the same pattern, and in both cases a successful browser check is your signal that the site is fine for you.


